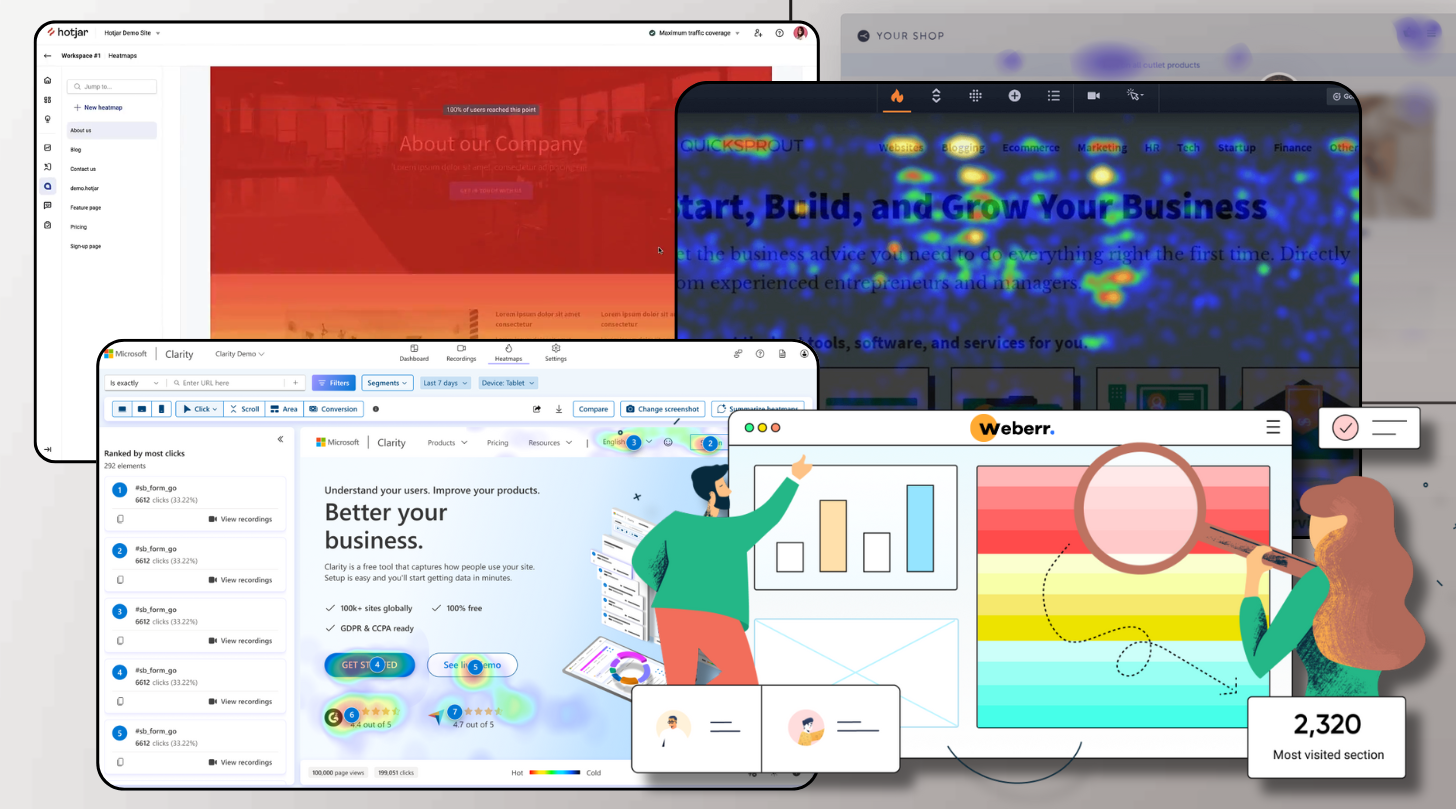
Understanding user behavior on your website is key to maximizing conversions. Website heatmap tools...

As an e-commerce business owner, every click matters. But are you truly understanding why customers click—or why they don’t? Are you making the most of every opportunity to convert visitors into buyers? Instead of relying on assumptions, leverage website heatmap tools to gain visual insights into customer behavior and make data-driven improvements.
Running an online store means constantly competing for customer attention. You carefully design your product pages, craft persuasive descriptions, and execute targeted marketing campaigns but are they effectively engaging your audience? While traditional analytics provide numerical data, they often lack the visual clarity needed to truly comprehend user behavior. This is where heatmaps and behavior analytics become invaluable.
Understanding Heatmaps & Their Importance in E-Commerce
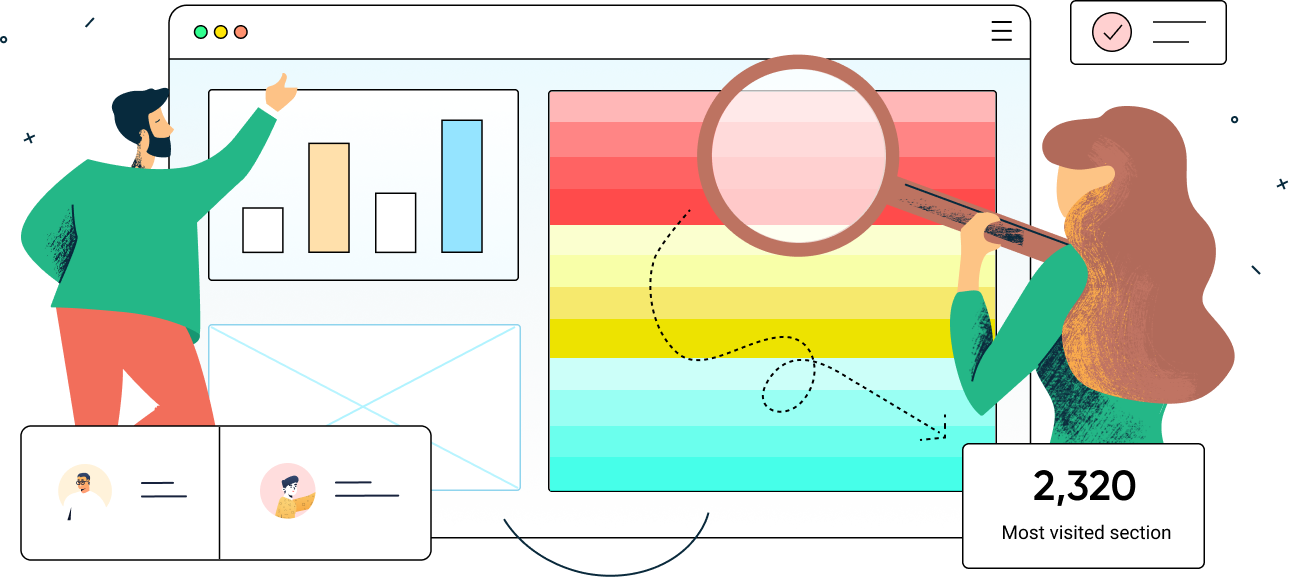
A heatmap is a visual representation of how users interact with a webpage. It highlights areas of high engagement (hot spots) and areas with little to no interaction (cold spots), giving you a clear understanding of what captures attention and what gets ignored.
For e-commerce websites, heatmaps provide critical insights such as:
✅ Which products or categories attract the most clicks.
✅ How far users scroll before leaving the page.
✅ Where visitors hesitate or abandon their carts.
✅ Which call-to-action (CTA) buttons perform best.
By leveraging these insights, businesses can optimize their websites to improve conversions and enhance the user experience.
Why Heatmaps Are Essential for E-Commerce Growth
Heatmaps offer a bird’s-eye view of customer interactions, revealing patterns that can significantly impact your conversion rates and sales performance. Here’s how they transform your e-commerce strategy:
1. Identify Conversion Bottlenecks
Are customers dropping off at a specific point in the checkout process? Heatmaps can pinpoint areas of friction, helping you streamline the journey for a smoother checkout experience.
2. Optimize Product Page Layouts
Are your best-selling product features getting the attention they deserve? Scroll maps show how far visitors scroll, ensuring crucial information appears above the fold.
3. Improve Call-to-Action (CTA) Placement
Are your CTAs driving action? Click maps reveal whether visitors are engaging with them and if their placement needs adjustment.
4. Enhance Mobile Shopping Experience
With mobile commerce booming, heatmaps can show how customers interact on different devices, helping you create a seamless mobile experience.
5. Understand User Intent
Hover maps reveal where users focus their attention, highlighting areas of interest and potential confusion.
How Weberr’s Heatmap & Analytics Tools Help Boost Sales
1. Identify High-Performing & Underperforming Pages
Not all pages contribute equally to sales. With Weberr’s heatmap and analytics tools, you can:
📊 Identify which product pages attract the most engagement.
📊 Detect low-performing pages that need improvement.
📊 Analyze visitor behavior to optimize key touchpoints.
🔹 Example: If engagement on your checkout page is low, simplifying the process or adding trust signals can help improve conversions.
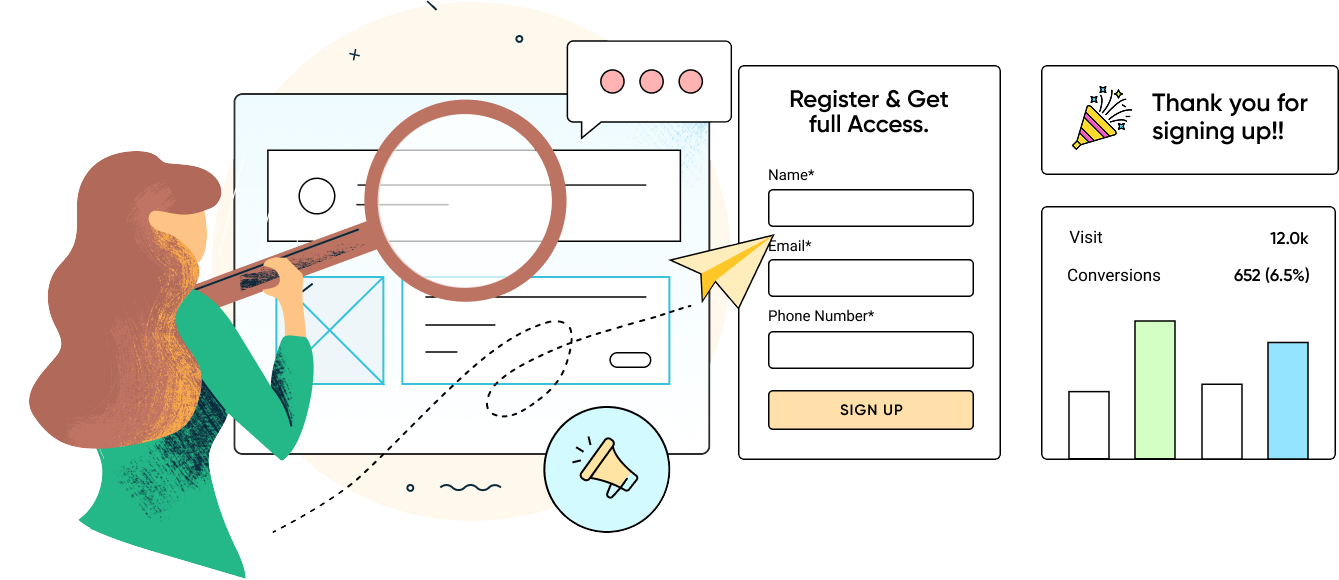
2. Optimize CTAs for Maximum Conversions
Your call-to-action (CTA) buttons play a crucial role in sales. Heatmaps allow you to:
✔️ Determine if customers are engaging with CTA buttons or ignoring them.
✔️ Test different button placements, colors, and wording.
✔️ Adjust CTA positioning for better visibility and conversions.
🔹 Example: If users click more on an image than the "Buy Now" button, repositioning the CTA can drive more sales.
3. Reduce Bounce Rates & Increase Engagement
A high bounce rate can hurt sales. Weberr’s analytics tools help you:
📉 Identify where users lose interest and leave.
📉 Optimize content to keep visitors engaged.
📉 Improve website navigation for seamless browsing.
🔹 Example: If visitors leave a product page too quickly, adding customer reviews, videos, or FAQs can increase engagement.
4. Improve Checkout Process & Reduce Cart Abandonment
Cart abandonment is a major issue for e-commerce businesses. With Weberr’s heatmap software, you can:
🛒 Identify where users abandon their carts.
🛒 Remove unnecessary checkout steps.
🛒 Highlight key elements like discounts and security badges.
🔹 Example: If many users drop off at the payment page, offering guest checkout or multiple payment options may reduce abandonment.
5. Optimize Landing Pages for Higher Sales
Heatmaps provide A/B testing insights, allowing you to refine landing pages for maximum conversions.
🎯 Experiment with different layouts, offers, and designs.
🎯 Track which images and content drive engagement.
🎯 Eliminate distractions to keep visitors focused on purchasing.
🔹 Example: If a product page has low conversion rates, testing a new layout or improving product descriptions may help.
6. Enhance Mobile Experience for Shoppers
With mobile shopping on the rise, optimizing for mobile users is critical. Weberr’s analytics tools help you:
📱 Compare mobile vs. desktop engagement.
📱 Improve navigation for a smooth mobile experience.
📱 Fix touchscreen usability issues.
🔹 Example: If mobile users struggle with small buttons, increasing button size and spacing can improve usability.
Final Thoughts: Supercharge Your E-Commerce Sales with Heatmaps
Heatmaps provide actionable insights that enhance the customer experience and boost sales. With Weberr’s heatmap and analytics tools, you can:
🚀 Optimize website layouts for maximum engagement.
🚀 Improve CTA placement to increase conversions.
🚀 Reduce cart abandonment to boost revenue.
🚀 Create a seamless mobile shopping experience.
💡 Ready to unlock your website’s full potential? Start using Weberr’s Heatmap & Analytics tool today and watch your sales grow!